SEE Features
Machine learning models can look like black-box decision-making programs. The question is: can we trust them? Understanding why a prediction was made is crucial to answer this question. GEMS-AI is an algorithm to enhance explainability and interpretability of AI based blackbox model. In particular it aims at :
Detecting model influence with respect to one or more (protected) attributes.
Identifying causes for why a model performs poorly on certain inputs.
Visualizing regions of an image that influence a model’s predictions.
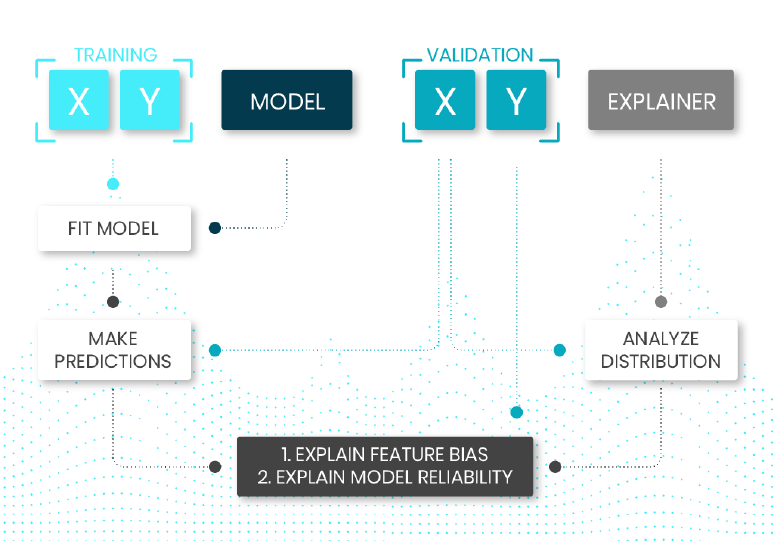
FROM STRESS TO EXPLAINABILITY
The validation data set is stressed to push the algorithm to its limits, yet remaining into its validity domain determined by the training set. The way the algorithm reacts to such perturbations is analysed and understood by GEMS-AI to explain the decision taken by the algorithm. This unveils the true behaviour of the AI based algorithm, thus promoting its understanding.
GEMS-AI is a Python package
to explain trained decision rules and to make sure they are fair.
At it’s core, the approach of GEMS-AI is to build counterfactual distributions that permit answering “what if?” scenarios. The key principle is that we stress one or more variables of a test set and we then observe how the trained machine learning model reacts to the stress. The stress is based on a statistical re-weighting scheme called entropic variable projection. The main benefit of our method is that it will only consider realistic scenarios, and will not build fake examples. It additionally scales well to large datasets.
GALLERY EXEMPLES
Here are some examples to see what you can see with
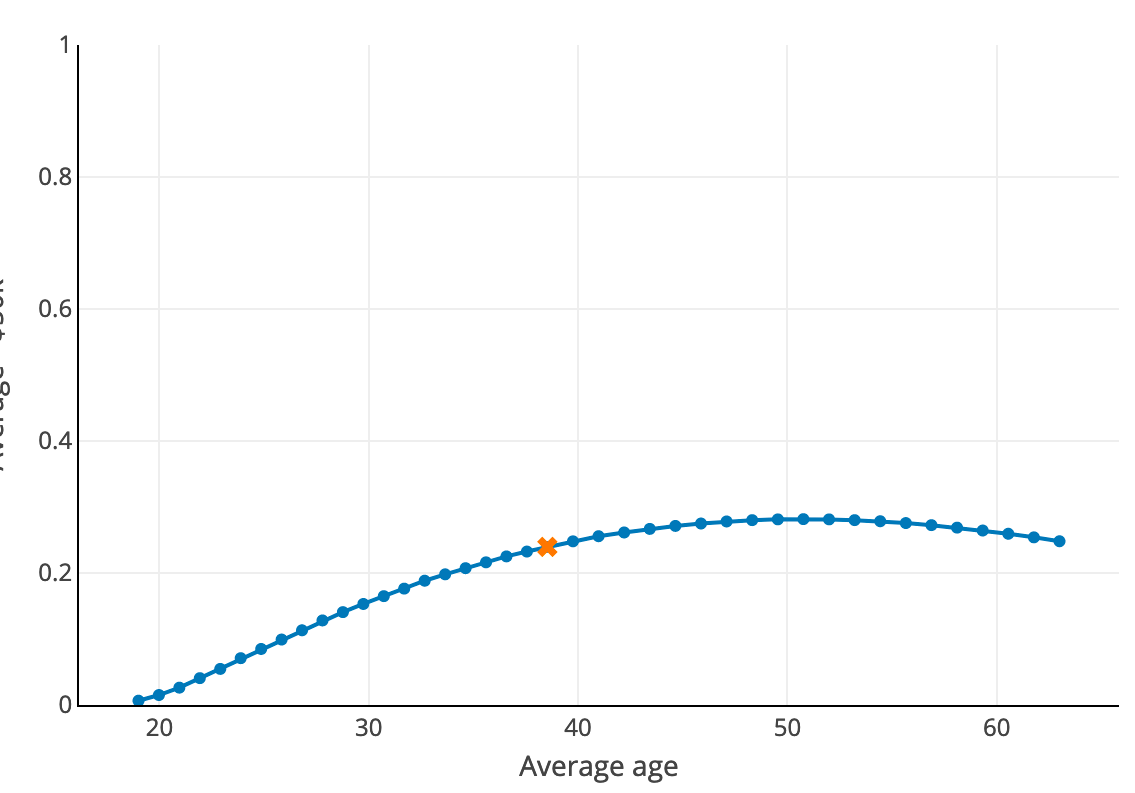
PLOT THE AVERAGE OUTPUT OF A MODEL RELATIVELY TO THE AVERAGE VALUE OF A FEATURE
Here, we plot the portion of bank customers predicted by machine learning decision rules as having an income higher than $50k with respect to their age. We can see that, on average, the older the richer until a certain limit. From about 50 year-old, the older the poorer, which probably reflects the fact that people are about to retire so companies don’t especially want to invest in them.cially want to invest in them.
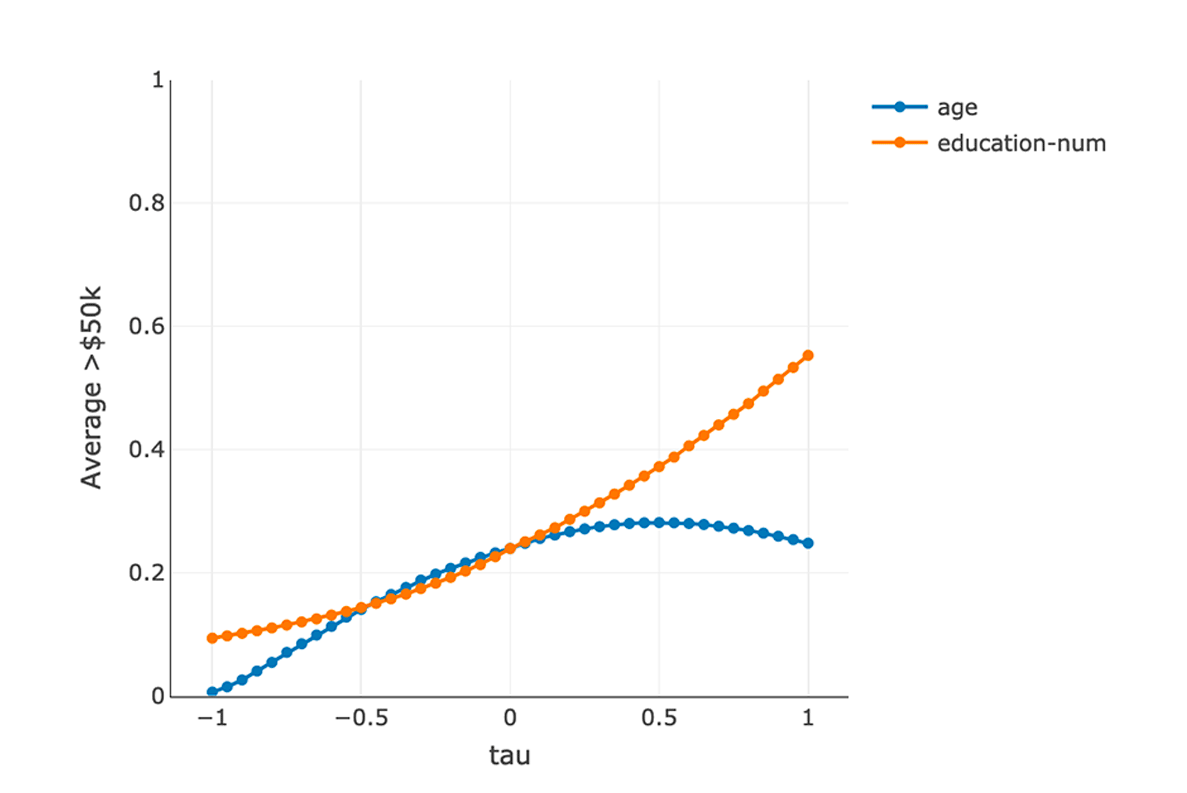
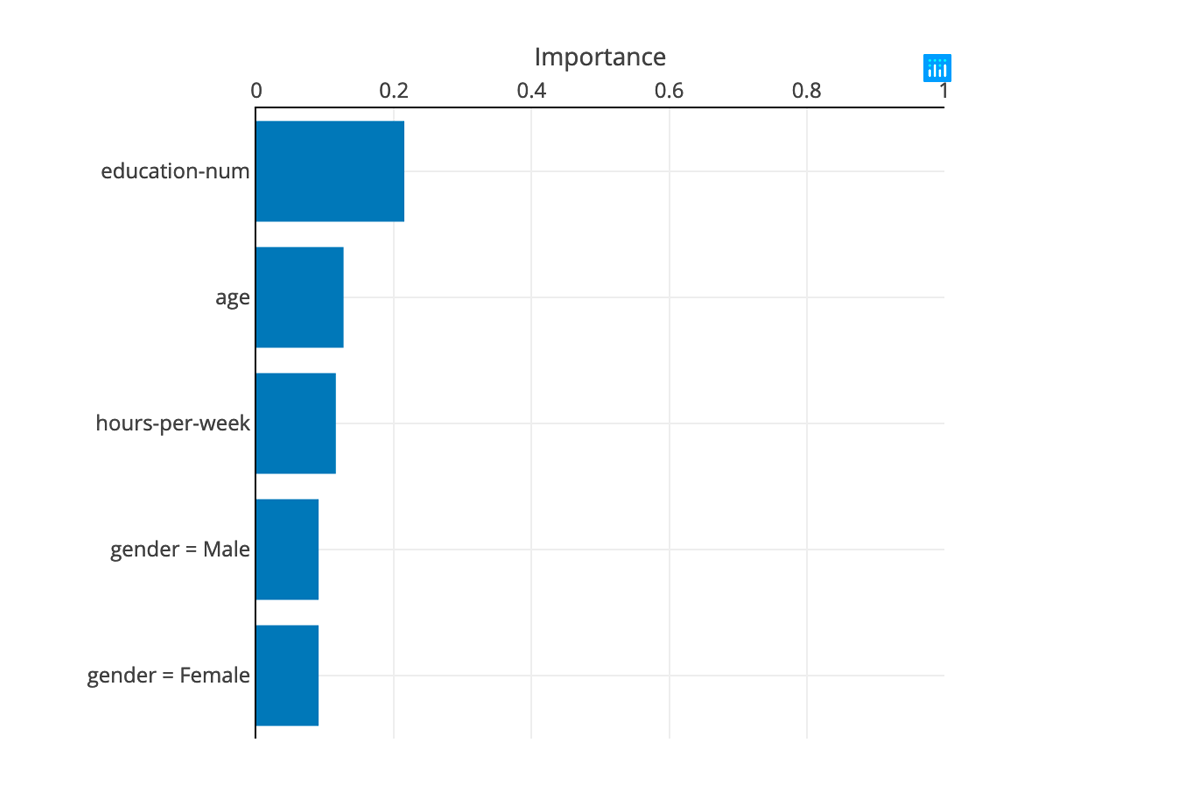
rank the features by their influence on the model.
Intuitively, a feature with no influence is an horizontal line y = original mean. To measure its influence, we compute the average distance to this reference line.
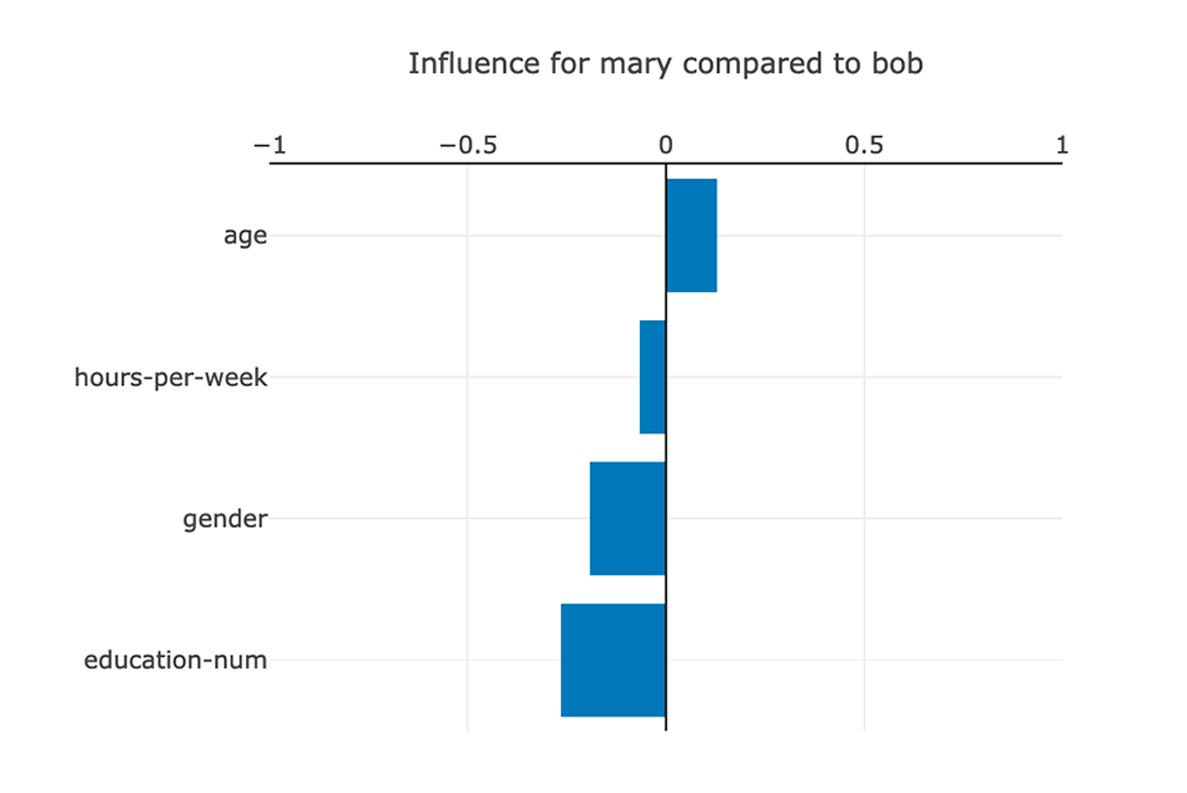
COMPARE TWO INDIVIDUALS BY LOOKING AT HOW THE MODEL WOULD BEHAVE IF THE AVERAGE INDIVIDUAL OF THE DATASET WAS DIFFERENT.
On the left, we can see that people having Mary’s age are on average 12.8% more likely to earn more than $50k a year than people with Bob’s age. On the opposite, we can unfortunately see that Mary’s gender is not helping her compared to Bob.
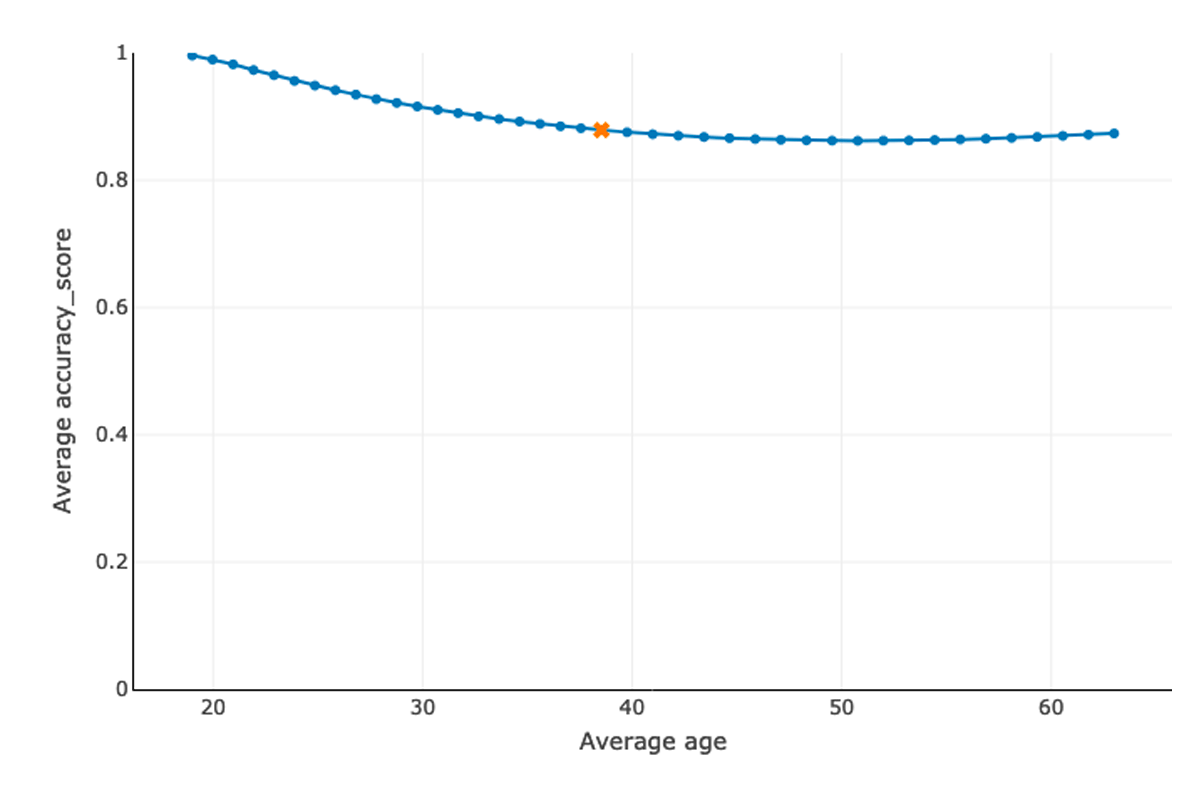
VISUALIZE HOW THE MODEL’S PERFORMANCE CHANGES WITH THE AVERAGE VALUE OF A FEATURE
Here, we can see that the model performs worse for older people, so we are probably lacking such data samples.
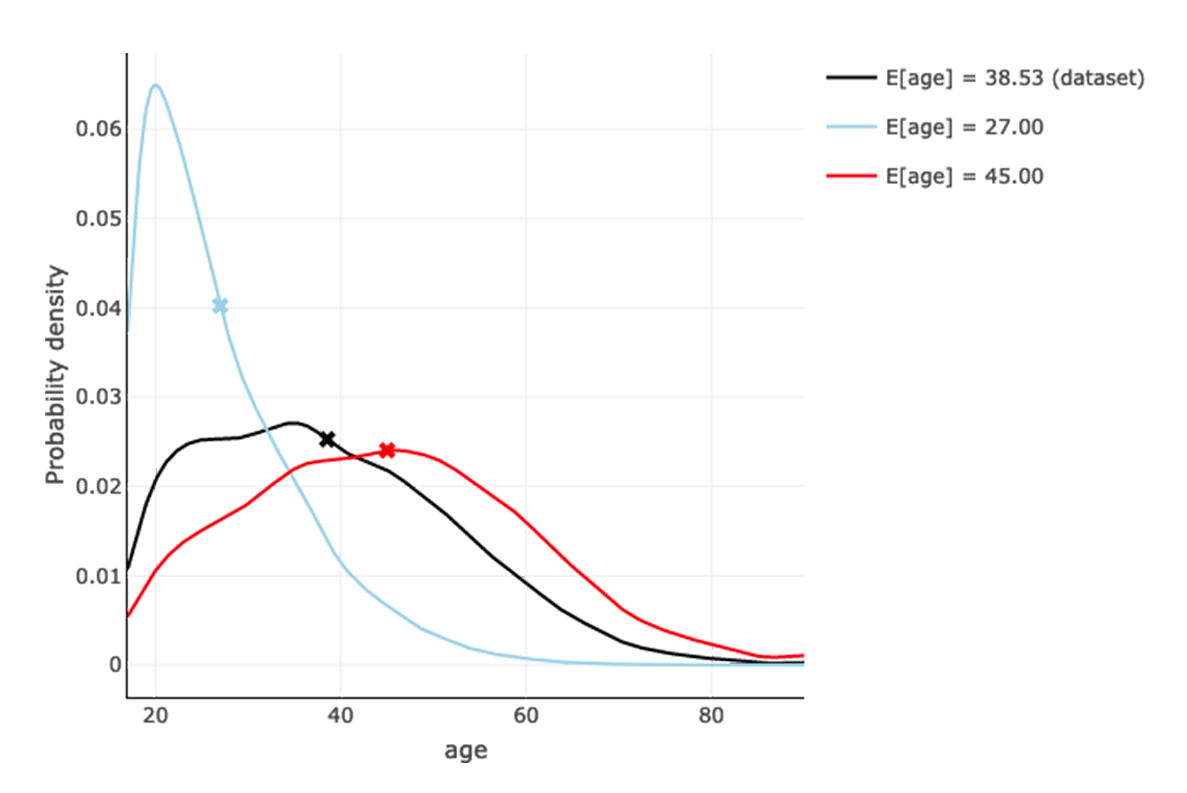
WE CAN VIZUALIZE THE STRESSED DISTRIBUTIONS FOR ADVANCED USERS.
As explained in the paper, we indeed stress the probability distribution to obtain a different mean while minimizing the Kullback-Leibler divergence with the original distribution.
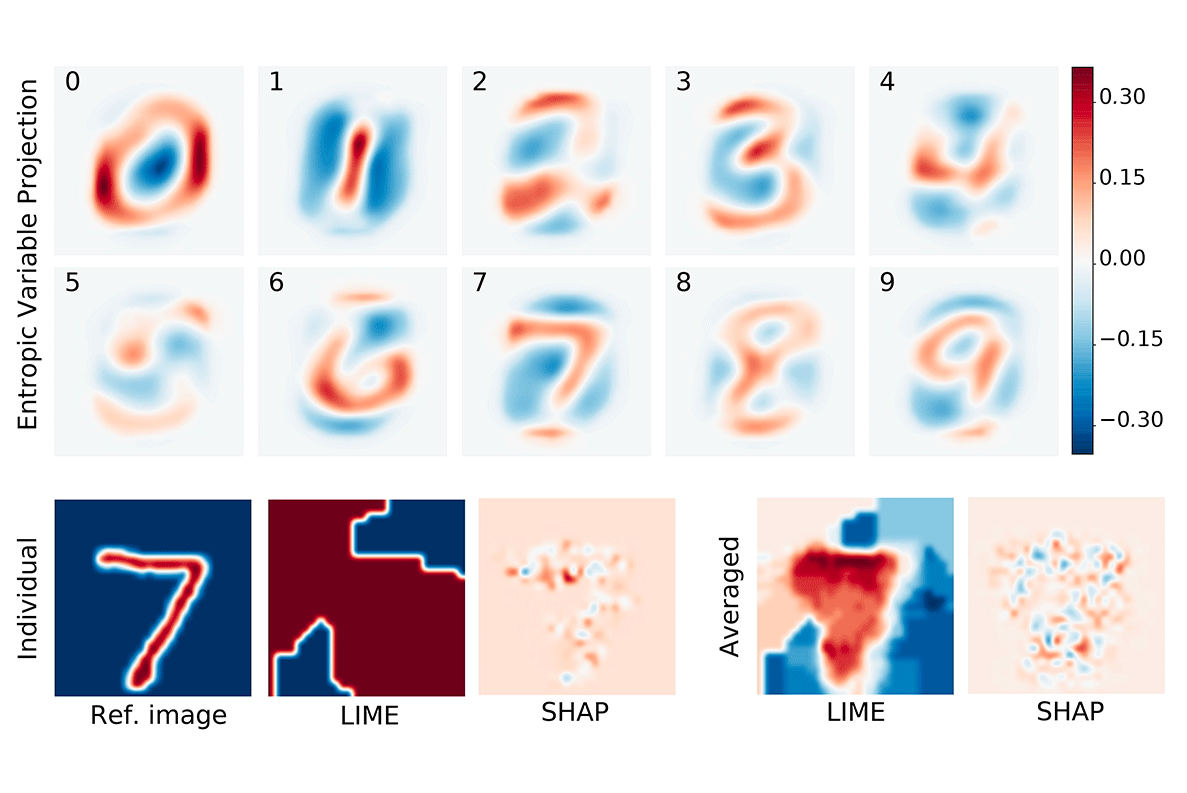
VISUALIZE THE INFLUENCE OF THE PIXELS ON THE OUTPUT
Presentation of the most influent pixel of the image.
What YOU CAN DO?
SEE FEATURES
Presentation of main characteritics of the toolbox and their properties.
USE TUTORIALS
Understanding how to use the toolbox through the study of some examples.
INSTALL API
Guidelines and tutorials to install the API.
CONTRIBUTE?
Some ideas or concerns on the toolbox: please come and join by contacting the research team.
Join our team to ask questions, make comments and tell stories about.
Code source on GitHub
You can find onGitHub : theIntroduction, Installation guide, User guide (Measuring model influence, Evaluating model reliability, Support for image classification), Authors and License.
Contact us
Toulouse
Mathematics Institute
118 Rte de Narbonne
31400 Toulouse - FRANCE
contact@gems-ai.com
